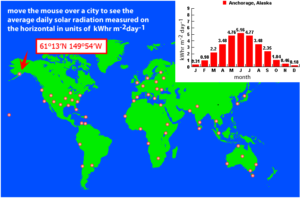
I found this site that has a global map with marked out cities. You can then click on each city to get a monthly insolation graph for that particular city.
- http://www.pveducation.org/pvcdrom/average-solar-radiation#
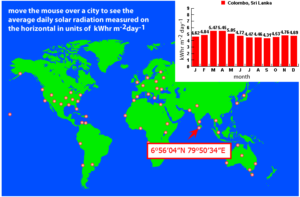
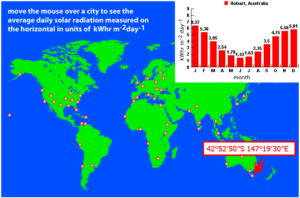
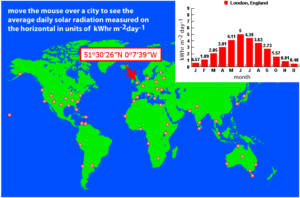
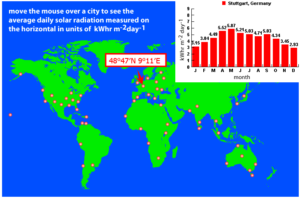
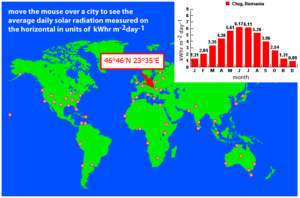
I clicked on all available cities and printscreened the data, in case the site goes down. I also added latitude data on the picture, from Wikipedia. Here are 3 of the 53 cities:
.
.
I took the data and put it on an excel sheet. Here is the highest and lower insolation of the 53 cities, in order of distance from the equator.
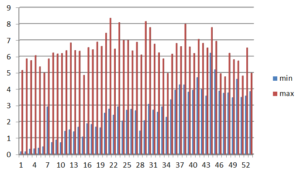
What I gather from the data is that ALL cities around the ENTIRE world have a summer insolation of about 6 kWh/m2/day, with a typical range of 5 to 7, with a few going up to 8. This leads me to the conclusion that the max insolation has to be 8, but it’s typically lowered by clouds and other factors.
It’s notable that all cities have about the same summer heat. It also make sense, since summer is when the tilting of the earth minimizes the angle at witch the sun hits the earth. Thus, it’s natural that all cities should receive about the same amount of the sun when they are hit straight on.
However, the winter is another story. Depending on were on the globe the city is, the maximum angle they can have is different. At lowest, they receive basically no insolation at all, and at highest, they hardly move at all from being hit straight on, so the winter insolation varies from 0.18 (with a max of 5.87) to 6.22 (with a max of 7.79).
If we chart the difference of the max (summer) and min (winter) insolation, cross referenced with their distance to the equator, we get this:
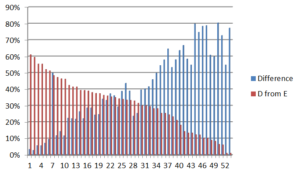
The red is the distance from the equator in latitude / 100, the blue is the insolation min/max. As we get closer to the equator (red going to the right), the temperature during the winter gets closer to the temperature during the summer, from 3% to left to 80% on the right.
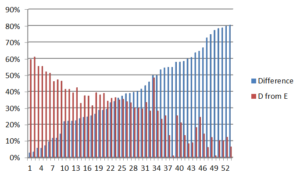
Same graph, this time sorted by min/max instead of distance from equator.
We notice a few anomalies: compare this three:
London, cold winters:
Stuttgart, very warm winters
Cluj-Napoca in Romania, cold winters like London.
I don’t get why Stuttgart is so much warmer during the winter than it’s neighboring cities.
This was the warmest one of the all:
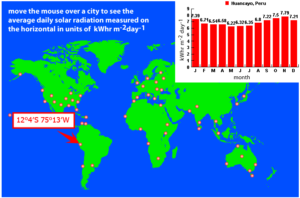
This guys have 6.22 as their lowest and 7.79 as their highest. Oh man.
A few questions: What are the effects of being costal on insolation? Elevation? Close to a mountain range, but not actually on one. What makes deserts so arid?
Not sure if I’ll investigate that, I got enough to cover my sun algorithm… I got enough to understand that there are local variations based on elevation and water.
Oh wait, I still don’t have the 11 year solar cycle pinned down.
Energy output from the Sun also changes as the sunspot count on the Sun changes. It is greatest when there are the most sunspots and lowest when there are the least sunspots. With satellite measurements, scientists have been able to confirm that the total solar energy varies 0.1% over one 11-year sunspot cycle. This variation of 0.1% means a global tropospheric temperature difference of 0.5oC to 1.0oC (source)
So that makes it about +0.37oC (0.75/2) warmer at the peak, and then the same amount colder 5.5 years later, repeating in a cycle. I was expecting more.
How the cycle works:
Sun flips its north and south magnetic poles every 11 years. A cycle starts when the field is weak and dipolar—basically, a giant bar magnet. But the Sun’s rotation is faster at its equator than at its poles, and this difference soon stretches the field lines like distended rubber bands around the solar surface. Frenetic activity ensues, with magnetic tangles producing sunspots, prominences, and sometimes flares and plasma explosions. All of that dies down when the Sun-wide magnetic field lines finally snap into simpler configurations, re-establishing the dipole field and beginning the next cycle. (source)
EDIT:
Leave a Reply