I need a number representing solar energy to feed to the grass, and why not use real numbers?
Solar energy is called Direct insolation. It’s measured in kW/m2/day
The total amount of sunlight you will receive per square meter depends on the latitude, the weather, the season of the year, and the time of day. These variables account for large differences in available insolation at any given moment in different locations around the world.
Despite the differences, insolation on a 1 m2 surface perpendicular to the sun anywhere on Earth receives approximately 1000 watts (1 kW) of solar energy on a clear day. This figure of 1,000 watts represents “peak” power or maximum power, undiminished by fog, smog or cloud cover.
Examples of Insolation Data
The following is a table of insolation data for Boston, Massachusetts
- Jan 1.66
- Feb 2.50
- Mar 3.51
- April 4.13
- May 5.11
- June 5.47
- July 5.44
- Aug 5.05
- Sept 4.12
- Oct 2.84
- Nov 1.74
- Dec 1.40
Daily Average: 3.58 Total for year: 1,307
Munich, Germany … which has a higher latitude than Boston has a level of 1,088. In other words Boston gets about 20% more sunlight than Munich.
Note: US solar radiation data tends to be shown as a daily average, while European levels typically are shown on an annual basis.
Okay, so now I got my basic input of energy into my world.
How does this match with the grass growth from previous research?
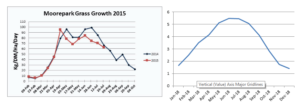
A nice overlap, so no surprises here.
NASA collected 22 years of data, and provides the monthly averages for the location you are interested in.
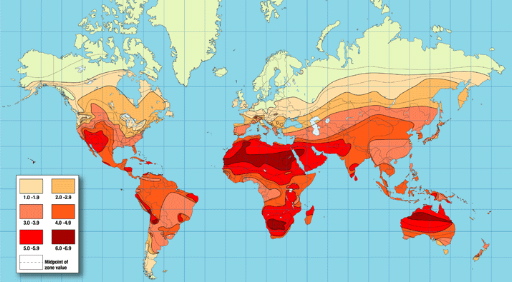
The following map gives you a quick idea of the differences between regions:
Close up:
Chart illustrating relative amounts of solar insolation throughout Texas, Maine, and Germany.

The range is between 2000 kWh/kW-yr. I don’t really undertand what “kWh/kW-yr” means.
Considering this quote:
One kWh represents the amount of energy needed by a 1000-Watt device (such as a clothes iron or a microwave oven) to operate continuously for one hour. (source)
It looks like the sun is basically frying each m2 each day with the same amount of energy that a microwave would use up in an hour. Or, with the same intensity as 1/24 of a microwave… or 1/12 if we consider that the sun doesn’t shine half day.
That number is for the cold north Europa. If we go closer to the mideteranian sea, we can double or triple that number. Times six where it’s the hottest.
The seasonal variation causes the energy to be about half the average during winter and double the average during summer. So the summer gets four times the winter.
I think I got a basic grasp now. This map:
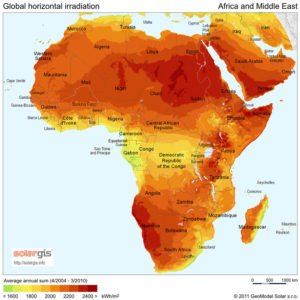
It puts the yearly insolation of hot regions at 2400 kWh/m2. If we divide that by the number of days per year (365) we get 2400/365= 6.5, the same number that the above global map showed for the hottest regions.
Here is another graph:
Fig. (6). Average monthly insolation for Brandis, Saxon, Germany (PVGIS 2009).
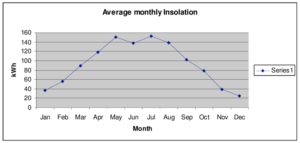
It again puts the insolation during summer at four times the amount during winter.
EDIT:
Incandescent light bulbs radiate 40 to 100 watts. The Sun delivers 1,360 watts per square meter. An astronaut facing the Sun has a surface area of about 0.85 square meters, so he or she receives energy equivalent to 19 60-watt light bulbs. (source)
Assuming that is per hour, the max insolation is 1360*12 = 16320, or less considering that most hours, the sun isn’t shining on the earth at a perfect angle. So maybe 10 kwh/m2/day is max? The highest value I have seen was a bit above 8.
Leave a Reply